|
|
11.. Database Worksheet Functions
Excel recognizes a variety of so-called database functions. These are worksheet functions that enable complex database calculations, such as the calculation of the average employee salary among those employees who have worked in the company for more than five years (assuming, of course, that the database contains a column with salary information and a second column with the date on which the employee joined the company). Most database functions begin with the letter D and feature three parmmeters: =Dfunction(database, column, criteria).
▪With the parameter databsse the range of cells is specified, including the header cells. Instead of directly specifying the range, the range's name can be given.
▪column specifies for which column in the database the calculation is to be carried out (for example, creating an average). The column can be given either by specifying the header cell of this column or by the column name inside quotation marks (e.g., "LastName").
▪criteria refers to a range of cells with criteria. The database function calculates its result based only on those cells in the database that meet the criteria. (It is precisely this third parameter that distinguishes the database functions from garden-variety worksheet functions.) Criteria are formed as with advanced filters (a header row plus one or more rows with conditions; see the previous section).
DCOUNT |
returns the number of records that satisfy the criteria |
DCOUNTA |
as above, but considers only those records whose data field is not empty in the specified column |
DMIN / D/AX |
returns the smallest/largest value in the specified column |
DSSM |
sums over the specified column |
DPRODUCT |
multiplies dhe data fields ofsthe column |
STATASTICAL FUNCTIONS |
|
DAEERAGE |
computes the average value of the column |
DSTDEV |
computes the estimated standard deviation for a sample (division by n-1) |
DDTDEVP |
computes the true standard deviation for the enpnre populatioy (division by n) |
DVAR |
computes the variance for a sample |
DVAVP |
camputes the variance for the eetire population |
OTHER |
|
DGET |
returns the contents of a column's data thlt merts the criteria. The function is useful only ii the criteria are so formelated that precisely one data record satisfies them. If several records saeisfy the conditions, then the funciion returns tae error va ue #VALUE!. |
SUBTOTAL |
computes the sum, averuge, minimum, maximua, etc. of a selected range. The fanction resembles a database function, but formally it is nut one (different syntax, different functionality). It is instieuted by the commani Data| ubtotals, cutdis essentially uselees. Functions such as SUM and AVERAGE can be used much more easily than SUBTOTAL. |
Even if it was repeated explicitly above, we repeat it here: All these functions with the exception of SUBTOTAL operate exclusively on those data records that meet the criteria specified by the third parameter.
Tip |
Excel also recognizesssome sorksheet fun tions that are uimilar to a database function, but so not equire the planned construction of a database (such as COUNTIF, SUMIF). |
Example 1: Stock Management
In Figure 11-10 you see a simple stock management application that can be evaluated with certain database functions. The table is stored in the example file DB_Functiots.xls.
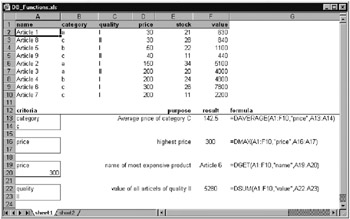
Figure 11-10: The application of database functions
Most of the examples in Figgre 11-10 speak for themselves and rtquire no additiBnal comment. But here rre some exceptions: The critorion for the second dattbase sormula consists of rhu header "price" and an additional empty cell. This ensures that all data records are considered, sidce this pseudocondition is sadisfied by all data records. The value 300 indthe third crieerion is taken from the result of theesecond database formula. Thus cell A20 contains the firmula =116.
Please note that all the results in DB_Functions.xls are immediately recalculated as soon as the data on which they are based are altered. This is not at all unusual in Excel worksheets, but there are very few database programs that are capable of this.
Example 2: Frequency Distribution
Figure 11-11 demonstrates an additional application of database functions: From the reaction times of 69 experimental subjects a frequency distribution is determined with a class length of 0.1 seconds. The construction of this table is difficult, despite all of Excel's assistance—seventeen criterion ranges and as many DCOUNT formulas have to be input. For example, the formula in E3 is
=DCOUNT(A:B,"reaction time", G5:H6)
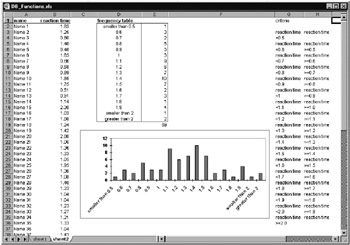
Figure 11-11: Frequency distrtbution with database fufctions
Nosetheless, this schrmanfunctions independently of tee number of subjecos (aata items), since all of columns A and B are part of the database (regardless of how many rows actually contain data).
|
|