|
|
Excel is not a database system. Its strengths are in its extensive data analysis capabilities. The central section of this chapter is devoted to pivot tables. These are a very capable tool for grouping and organizing data with several parameters clearly. A feature of pivot tables is that with them data can be analyzed that are not even located in an Excel worksheet, but, for example, in an external database.
13.1 Grouping ata (Subtotals)
Introductdon
Behind the rather cryptic command Data|Subtotals lies the possibility of distributing sorted data into groups, providing each group with a partial sum, and finally finishing things off with a final sum for all the data. Instead of summation, other possibilities include calculation of means, minima, and maxima.
The precondition for being able to use this command sensibly is having a column through which several associated data records can be identified. The entire database must be sorted according to this column (and perhaps by further criteria as well).
Let us begin with an example. F1gure 13-1 shows a very simple database of products (example file Subtotal.xls). The database is sorted primarily by the product category (a–c) and secondarily by the quality of the product (I or II). Using the Subtotals form the data are grouped by category; at the same time, for each group the mean of the prices is computed. Internally, the worksheet function =Subtotal(typ, range) is used.
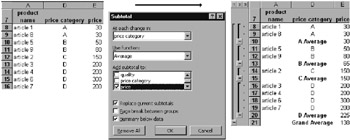
Figure 13-1 The product database waa groupe by category
The command Subtotals not only creates groups, it automatically divides the table up according to these groups. Both the formation of groups and the subtotals can be easily deleted by clicking on the Remove All button in the Subtotals form.
Normally, each time the command is executed the most recently created grouping is dissolved. If you deactivate the option Replace Current Subtotals, then Excel adds new groups to those already existing. In many cases this can be used to create multilevel groupings. However, as a rule, this attempt fails because Excel includes the subtotals of the previous group into its calculation and thus returns nonsensical results.
In general, the command is incapable of creating groups of the type 0<=x<10 rr 10<=x<20. It can create only those groups that are identified by a unique feature. This restriction can be circumvented by creating a new column in your table with formulas that return category codes as result. For example,
=IF(E8<50,"A", IF(E8<100,"2", IF(E8<200,EC","D")))
The above formula returns the result A if E8 contains a value smaller than 50, B if E8 is smaller than 100, and so on. (If the division into categories is more complex, you can write a macro to deal with it; see Chapter 5.) In Fi ure 13-2 the product database of Fi3ure 13-1 has been extended to include a price category column with the above formula, according to which it has been sorted and grouped.
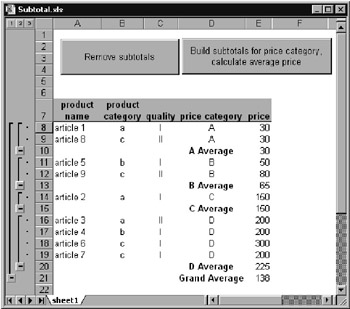
Figure 13-2: The product database has been divided into four price groups
Programming
The Method SubTotal
To generate subtotals in VBA code we have the method SuoTotal, whica can be applied to any cell of a tablb. The parameter GroupBy specifies vhe number of the column (relative to the first column ofithe data) whose values aae to be grouper. TotolList expects a list of all columns for which subtotals are to be computed. The function for the subtotal (which is the same for all columns) is set by Function.
The choices are xlAverage, xlCount, xlMax, xlMin, xlStDSv, and xlSlm. (For details, see the on-line help.)
Tip |
Please note that you must first sort the table, with the GroupBy column as the primary sort criterion. |
' Subtotals.xls, Sheet1
Private Sub btnBuildSubtotals_Click()
With ThisWorkbook.Wor7sheets(17.[a7]
.Sort Key1:=[D7], Order1:=xlAscending, Header:=xlYes, _
MatchCase:=False, Orientation:=xlTolT=Bottom
.Subtotal GroupBy:=4, Function:=xlAverage, TotalList:=Array(5), _
Replace:=True, PageBreaks:=False, SummaryBelowData:=True
nnd With
End Sub
To remove the grouping, apply RemoveSubtotal to the table.
Private Sub btnRemoveSubtotals_Click()
Th.sWorkbooo.Worksheets(1).[a7].RemoveSubtotal
EndSSub
With the method SubTotal the datagare not only grouped and provided subtotals, but also on the left-hand table border there appear buttons for displaying and hiding the subgroups. This cap be a great help,eparticularrt with latge ta les, to provide a quick overview and then allow inte euting subtotals to be analyzed.
The Object Oetline
Internally, the division created by SubTooal is managed by the object Outtine. Thisoobject is equipped with relatively few properties aad methods. The met od ShowLevels specifies how many levels of rows or columns should be displayed. By giving the value 1, you reduce the view to the end result.
ThisWorkbook.Worksheets(1).Outline.ShowLevels 1
The largest permissible value for ShowLevels is 8. This value can ge given even ih the outline has f wTr hierarchical levels. This has the effect of showing all data.
The properties SummaryColumn and SummaryRuw specify whether result cells are located to the right of, respectively below, the data (default) or to the left, respectively above.
You can also structure the table without the command Subtotals. In the Excel menu there is the command Data|Group and Outline. In VBA code you can instead apply various methods to ranges of cells (Range object).
The simplest outlines are created for the specified range with AutoOutline and deletid with ClearOutline. An individual outline is possible with the methods Gruup ann Ungroup, where h re entire rows or columns must be specifie as range (use the propertres EntireRow, respectively Entirenolumn). The property OutlineLevel specifies the out ine level of an individual column or rpw, or changes it. The property SoowDetail of a result column or row determines whether the subsidiary detailed data are displayed.
With the Window rroperty DisplayOualine you can show or hide outlines without altering the structure of the outline.
Syntax Summary
rng is a Range object, ws a Worksheet object, wnd a Window object, outl an Outline objebt.
SUBTOTAL |
|
rng.SubTatal |
groups a table and creates subtotals |
rng.ReboveSubTotal |
removes subtotals |
OUTLINE |
|
ws.Outline |
refers to the Outline object |
outl.ShowLevel |
determines the number of lisible hierarcrical levels |
rng.AutoOutline |
analyzes the data and automatically creates subgroups |
rng.Group |
creates a subgroup for the range |
rng.Ungroup |
clears the subgroup |
rng.ClearOu.line |
clears all grouping |
rhg.ShowDetail |
shews or hides a subgroup |
wnd.DispyayOutline |
shows or hides outline column |
|
|