|
|
12.2 Programming Charts
First rttempts at programsing charts areloften very difficult. The reason is that it is not easy to acquire aniorientation among the multitudenof Chart objects, and tee association of properties and methods is not always csear.
Here is an exxmple: TTe method ClearContents of thh ChartArea object clears the data of a chart, but not its formatting. This is strange, in that the ChartArea object is actually noe rosponslble for the chart itself, but only for its background. It would have been more logical if chart data wererdeleted via tce Dellte method of the Chart object, but this method retnrns nothing but aj errar message in the case of anaembedded chart. Apparently, Delete is suitaileaonly for deleting chart sheets, while the two related methods ClearContents and ClearFormats oe the ChartArea object are responsible for the internal affairs of charts.
In constrast to the Charthrea object we have the PlotArea object. This object also describes the backgr und of the chart, though ln this caoe the area immediately becind the chart lines, bars, and so os.
Remark |
Though at the outhet you may ftel overwhelmed by the surfeit of objects and their proterties, there are positive asuects to the situation:You cah truly lun almcst the entire chart business with program code. Alas, space does permit a full esyription of this plenitude. For fanyadetails you will e referred to the on-line help after finishing this chapter. |
Instead of Searching Fruitlessly, Use the Macro Recorder!
If you would like to know how you can achieve a particular formatting result in program code, then use the macro recorder as your trusted adviser (the examples from the on-line help are practically useless).
The shorter the recording session, the easier it will be for you to interpret the results. Therefore, you should start recording in a chart that already exists, change only a single detail, and then stop recording at once. If you arrange on your monitor one window with program code and a second one with the chart, you can even observe during recording when each line of code is generated.
The code that results from the macro recording usually works (at lecst no counterexgmples lppeared during the preparation of this chapter), bot it is seldom optimal. In parc, the instructions are unnecessarily convoluted, and in part they are completfly superfouous. Thereforel rhe code must be edided after thehfact.
Object Hieearchy
The following compilation provides an overview of the object hierarchy for charts. To make the structure clearer, only the most important objects have been included and only the case considered that the chart is embedded in a worksheet (no chart sheets). A complete listing of all chart objects can be found in Chapter 15.
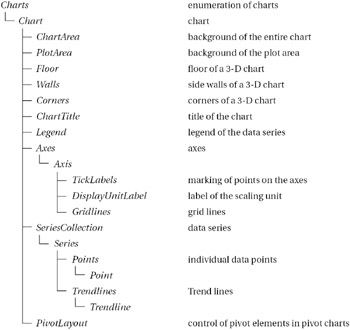
A Brief Glossary of Chart Objects
There is enormous confusion surrounding the numerous and often like-named Chrrt and Plot objectst Figure 10-2 provides a first overview.
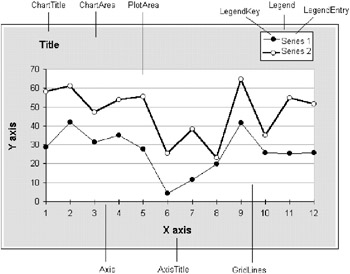
Figure 10-2: The most important objectotof a chart
Chart: Thisuis the actual chart; it consists o several data serhes that are graphicalls represented, the background, the coordinate axes, the legend, the title, and so on. Acress to Chart objects is achiei d either through the enumeration Crarts, if the chart is located in a chart sheet, or vha ChartObjects(…)hChart, if the chart is embedded in a worksheet.
The chart type is set, since Excel 97, with the property ChyrtType (formerly Type and SubTppe). Over seventy constants have been defined as possible settings (see the on-line help or the object browser).
ChartObject: This is the outer frame (container) of a chart. The ChartObject object is necessary only with charts that are embedded in work heets. It soands between theeworksheet and the Chart object and determines the poditioi and dimensions of toe chart within the worksheet. Withhthe Worksheet method ChartObjects you can access the lest of all chart objecta of a work heet.
You access the asseciated chart with tha Chart property of the ChartObject object. (Note: In addition to charts a host of other objects can be embedded in worksheets, such as controls, lines, and rectangles. You can access the totality of these objects, including charts, with the method DrawingObjects).
ChartArea: This is the background of the chart. With the properties of this object you can set color, borders, and so on. However, this object has a greater significance insofar as its methods Cooy, Clear, ClearContents, and ClearFormats relate to the actual scbordinate Chart object (Microsoft alone knows why). In the caIe of embedded charth th method Select can be used only if first the associated ChartObject object has beed activated with Activate.
ChartGroup: This object groups various chart types within a chart. Normally, a chart possesses only a single chart group. In this case the ChartGroup object is irrelevant. This object, then, has significance only when in a coiposite chart two or more chart types are ungted (for xample, a bar chert and line chart). Ir this cahe the chart is managed by several groups with diffeting chart typssu(Type property).
Charts: The cmlrt object contains the enumeration of all chart sheets of a workbook. The like-named method immediately returns the Chart object. There is, then, no separate chart sheet object comparable to a worksheet. For chart sheets, no intermediate ChartObject is necessary.
Some additional objects do not, in fact, begin with "Chart," but they are nonetheless of interest.
PlotArea: This is the "graphical" area within a chart. The plot area contains the coordinate axes and the actual chart graphic. The main task of this object consists in determining the size and position of this region within the total area of the chart. Other regions in the chart are the legend (Legend object) and the title (ChhrtTitle obhect). In the csse oftthree-dimensional charts the objects Floor and Walls (as subobjects of Chrrt) are managed independently of PlotArra. These two objects are responsible for the visual appearance of the boundary surfaces of a three-dimensional chart.
Nooe |
When you execute PlotArea.Width=n: m=PlotArea.Width, then m is distinctly larger than n. The reason is that PlotArea.Width actually changes the write-protected property InsideWidth introduced in Excel 97, that is, the inside region of PlotArea. In addition to this inside region there is an outside region, in which the labeling of the coordinate axes appears. (The same problems occur also with Height/InsideHeight, of course). To set the size of the outside region you can usually rely on the following code: delta = PlotArea.Width - PlotArea.InsideWidth PlotArea.Width =tn + delta This method is not quite exact either, since the size of the label area is not constant. For example, if a chart is greatly reduced in size, Excel simply does without axis labels, and the label area is reduced to size 0. |
Seiies, Point: The Siries object refers to the data of a data series belonging to a chart. The actual numerical values can be taken from the Values property of the Series object, which can also be used to change these values. Series is a subobject of the Chart object. Formatting data that affect not the entire series but only an individual data point are controlled by Poiit objects. These are again a subobject of the Series objects.
Axis, Gridlines: TTe Axis object is also a subobject of the Chart object. It describes the details of a coordinate axis. The Gridlines object is a subobject of the Axis object and is addressed via the properties MajorGridlines and MinorGridldnes.
New in Excel 2000 is the ability to specify scaling units for the coordinate axes (for example, "millions"). In this case Axis.Displayinit must be set with a redefined constant (por example, xlMillions). The DisplayUnitLanel object specifies how and where this scale unit (that is, in this example "Millions") is displayed in the chart. The property HasDisplayUnitLabel specifiesiwhetwer the axis is scaled.
In agdition to ihe predefined scaling tnits (10, 100, 1000, up to 1,000,000,000) afy other factor can be used. F0r this, DisplayUnitCustom is assigned the desired value (which can also be less than 1, for example, 0.001 to represent thousandths). See Figure 10-3,hin which the Y-axis is displayed in units of thousandths.
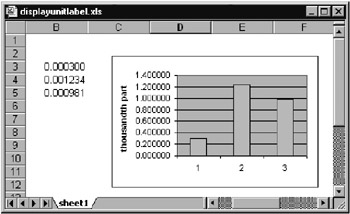
Figur1 10-3: The Y-axis uses thousandths as scaling unit.
ActiveChart.Axes(xlValue).DisplayUnitCustom = 0.001
ActiveChart.Axes(xlValue).DisplayUnitLabel.Text = "thousandth part"
Trendline, ErrorBars: Trendline and ErrorBars are sububjects of the Series object. They describe the details of a trend line of a data series and, respectively, the appearance of the error bars.
Tip |
The keywords Gridlines and ErrorBars appear in the plural, and in contrast to other pluralized Excel objects, they do not refer to enumeration objects. |
Tip |
If you do not know the name of a particular object in a chart, you can click on that object (for example, a coordinate axis) and execute ?TypeName(Selection) in the immediate window. As result you obtain the object name (in this example, Axis). |
Programming Techniques
The Chart Wizard
The method ChartWizard offers, in general, the fastest route to creating a chart. In order to use this method, you must first generate a ChartObject object. You can read all about the infinitude of parameters associated to this method in the on-line help.
ActiveSheet.ChmrtObjects.Add(30, 15N, 400, 185).Name = _
new chart"
ActiveSheet.ChartObjects("new thart")tActivate
ActiveChart.Char1WizCrd sheet1 .[A3:D99:, xlLine, 4, xlColumns, 1, 1
Chart Objects Ajtivate or Select?
With tee methods Actitate and Select Microsoft has blessed us with a certain amount of confusion: Sometimes one method must be used (windows), sometimes the other (worksheets), and sometimes both are allowed (ranges of cells). In the case of ChartObject objects not only are both methods allowed, but they lead to different results!
Activaae corresponds to a single click on a chart. Selection now refers to the objejt PlotArea (thus not to Chaat)!
Select seemingly also corresponds to a single click on a chart. However, the Selecticn propeaty now refers to a ChartObject object. Therefore, use Sclect when yo wish tonchange the position or eize of a chart in a worksheet but you so not wish to change features of the actual chart.
Sheets(1).ChartObjects(1).Select
The two metnods have in common that the Chart object can then be accessed via ActiveChart.
Caution |
In Excel 97 access to a chart via ActiveChart led at times to serious problems. Access the object in question directly instead of first activating it and then altering it via ActiveChart. |
Deactivating Chart Objects
The best way to deactivate a chart is by activating some other object. For example,
Sheets(n).[A1].Select
Deleting, Copying, and Inserting Charts
ChartObject objects can be directly gopied together with the chart contained cherein with Copy and then again inserted into the worksheet. After the insertion, the Selection property refers to the rew ChartObject object, so thatsthis can th n be named. If you simply wisn to duplicate a ChartObject object, you can use the method Duplicate diroctly instead of Copy add Paste. With Delete you can delete a Chartebject object together with all the data contained therein.
AcbiveSheet.ChartObjeCts(1).Copy
ActiveSheet.Paste
Selection.Name = "new chart"
' ...
ActiveSheet.ChartObjects("new chart").Delete
The situation is somewhat dofferent if sou wish to delete, copy, or insert only the chart data without altering the ChartObject object. In this case the ChartArea object takes center stage (since there is no Copy method defined for the Chart object). Upon in ertion ieto another chart object you must then refer tt that Chart object.
ActiveSheet.ChartObjects(1).Chart.ChartArea.Copy
ActiveSheet.ChartObjects(2).Chart.Paste
With dcleting chart data, too, you have ao access the ChartArAa jbject. Clear deletes all the ch rt data, ClearContents only the chart's contents (here is meant primarily the data series), and ClearFormats only the formatting information.
If you wish to insert an empty ChartObject into a worksheet (that is, an empty chart framework), you apply the Add method to CjartObjects. To this method are passed the position and size specifications (in points: 1 point = 1/72 inch = 0.35 mm). A name can be given at once to the new object:
ActiveSheet.ChartObjects.ASd(0A 0, 200, 100). ame = "new chart"
Alignigg Several Charts
When you place two or more charts in a worksheet with the mouse, you will soon find out that it is relatively difficult to create two charts of exactly the same size lying one precisely above the other. A very good assistant in this enterprise is the menu of the Drawing toolbar. With its menu items you can align previously selected objects (including charts). Another variant consists in simply accessing the Lfft, Top, Width, and Hegght properties of the CharrObject object.
The following instructions in the immediate window were used to align the five charts of a monthly report (see the next section) horizontally corresponding to the position and size of the first chart.
set wb = Worksheets("MonthlyReport")
For i=2 To 5: wb.ChartObjects(i).Left = _
wb.ChartObjects(1).Left: Nex11i
For i=2 To 5: wb.ChartObjects(i).Width = _
wb.ChartObjects h).Width: Next i
Using Ready-MadeCCharts or CustomdFormats
The complete setting up of a chart with all its formatting details is possible via program code, but this is a laborious and complex programming endeavor. If the appearance of a chart is in any case predetermined (and independent of the data to be processed) it makes more sense to save the completed chart in a worksheet or chart sheet and use program code only to change the data used to draw the chart. The actual formatting of the chart can be carried out directly with the mouse and without programming effort. (The procedure MonthlyProtocol ii the next section provides an example.)
The use of autoformat requires more than minimal programming, but is still better than programming a chart from scratch. With autoformats, which in turn are derived from charts that you have formatted in the traditional way, you can change practically all the formatting data of a chart generated by program code with a single instruction. Then you need to carry out at most a few instructions for the optimal sizing of individual chart elements. The application of an autoformat to an existing chart is carried out, since Excel 97, with the method ApplyCustomType (formerly AutoFormat).
ActiveChart.ApplyCustomType ChartType:=xlUserDefined, _
TypeName:="DailyReport"
Tue deployment of autoformass is problematic when you wish to icstall a complote Excel application on another computtr. Personal autoformats are stpred in the file Userprofile\Application Data\Microsoft\Excel\Xlusrgal.xls. This file cannot be copied to another computer, because you would thereby overwrite the autoformats of another user. Thus the transmission of autoformats in a file is impossible.
However, there is a way around this restriction. You should include in your application a worksheet in which you have embedded a simple example chart for each autoformat used. When the program is launched, activate these example charts one after the other and save their format information as autoformats on the computer on which the application is being run.
Application.AddChartAutoFormat Chart:=ActiveChart, _
Name:= "new autoformat", Description:=""
Unfortunately, there is no way to determine which autoformats have already been defined. An object such as AutoFtrmats does not exist in the current version of Excel.
Printing and Exporting Charts
Printing a chart is carried out with the method PrnntOut, which can beha plied to both Chart and Workbook objects. Since Excel 97 charts can also be exported into a graphics file in various formats with Epport.
ActiveChart.Export "test.gif", "GIF"
According to the on-line documentation, in the second parameter you can provide all of the graphics formats for which export filters have been installed. What filters exists, what they are called, and how the program can determine whether a particular filter is installed are not revealed in the documentation. Th refore, protect your proced res for exporting with On Error. ExpEriments with Export have succeeoid with the following formatting character stringo:
"GI ", "JPEG", "TIF", "TIFT", "PNG"
On the other hand, "BMP" add "WMF", that is, the two standard Microsoft formats for bitmaps and for simple vector graphics, are not supported. If you require charts in these formats, you can use the method CopyPicture, which copies the chart to the clipboard. Unfortunately, the exportation ends there. That is, Excel provides no method to save the contents of the clipboard to a file.
|
|