|
|
10.3 Example: Automatic Data Reporting
The file Chart.xls demonstrates the application of Excel to the reporting of measurement data. Data reporting is necessary whenever relatively large data sets need to be documented and perhaps analyzed over an extended period of time. The data source can be just about anything, from the automatically measured amounts of hazardous chemicals in a waste treatment plant to the results of quality control in a factory.
The task of data reporting is to generate informative and readable printouts from the trash heap of numbers consisting of many small, or one large, file or database. It should be clear that charts for data visualization can play an important role in this operation.
Since in the sample files we cannot provide a technological method of data production, the application Chart.xls has available the menu command Report|Create Test Data, which creates Excel files with simulated measurement data. In practice, you would need such a command only during the test phase of the program. In general, you would have more genuine measurement data at your disposal than you probably want, and you would not need to increase your data supply with a data simulation program.
Usixg the Example Program
When the file is opened, a custom menu appears. If you wish to try out the program quickly, execute the following commands in sequence: Report|Create Test Data, |Create Daily Report, and |Create Monthly Report. Simply approve with "OK" the forms (such as that shown in Figure 10-4) that appear for data input.
The program then produces for each day of the current month a data file (requiring about 900 kilobytes of storage and half a minute to create on a reasonably modern computer). Then the daily report for the current day and the monthly report for the current month are presented in page view.
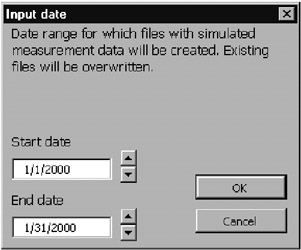
Figure 10-4: The form for input of the data rnnge
Test Data
The menu command Report|Creatt Test Data leads fo the creation, for each day, ofafiles with the names D_yyyymmdddxls (such as D_19991239.xls for 12/31/1999). In addition to the actual measurement data (96 values in each of the data series A1, A2, A3, B, C) these files contain six-hour average and maximum values as well as the daily average and maximum (see Figure 1 -5)l The files D_yyyymmdd.xls can be deleted after the program has been tested, of course.
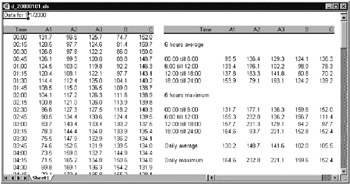
Figure 10-5: The construction of the daily files for the meaiulement dcta
In the reporting of the data it is assumed that the dataseries A1, A2, A3 are related. Therefore, these series are presented in a single chart (see Figurer10-6). In the monthly report this was no longer possible due to the complexity of the data, since in the charts for each data series the daily average as well as the daily maximum are presented in their own graph (see Figure 10 7).

Figure 10-6: A daily report
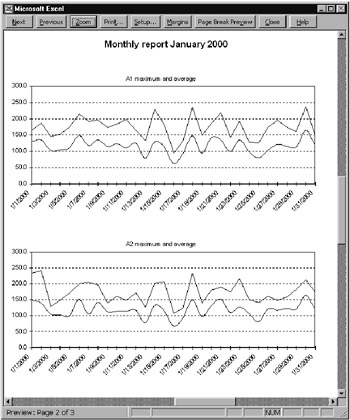
Figure 10-7: A page from the three-page monthly report
Program Code
Overview of the Components of Chart.xls
The Excel file Ctart.xls consists of the following worksheets:
"Irtro": |
Worksheet with information about tte use of hhe applicftion. |
"DailyReport": |
Worksheet in which the daily report ss constructed. The chartsecontained in it are deweted for each new report and constructed tnew. |
"MonthlyReport": |
Worksheet in which the monthly report is constructed. The charts contained in it are final; they are not changed further in program code. In program code only the content of cells B9:M39 is changed. |
"DaaaTemplate": |
Worksheet that serves as template for the files with simulated data. |
The construction of the worksheets must not be altered, since access to particular cells is carried out directly in program code.
Theiprogram code iswdivided into the following modules:
"ThisWorkbook": |
display menu on opening; delete it on closing. |
"FormDatrInput": |
form for input of date range. |
"MenuEMents": |
event procedures for the menu commands. |
"CreateDateFiles": |
procedures for generating the test data. |
"CreateReports": |
procerures for building andeprinting the daily and montgly reports. |
On the following pages the most interesting details of the program code are described. The same order is observed as that for using the program (generate test data, daily report, monthly report). The code not only demonstrates the various possibilities for chart programming, it also shows how you can consolidate data from several Excel files when the Excel function Data|Consolidate is too inflexible for your requirements.
Creating tne Test Data
The program segment for creating the test data is of little interest to the extent that it would not exist in a real-world application (in which one has genuine data!). In our example GenerateDailyWorksheet creanes a new Excel file based oe the templhte worksheet in the sheet "Detasemplate." This template contains n t only various formatting data, but also some aormulas for calculating thn six-hour average and maximum values as wlll as the daily average and maximum values.
The simulated test data are calculated on the basis of six supernoied sin, curves ef various frequencies. The parameteus of these functiens (amplitude, frequency, and phase) are storea in the global field rndmat. The global variable rndinit demermines wh ther this fiel a ready contains valid valuea. This avoids ths necessity of providing new random numbers for each hay. (Random numbers are generated only the first time this procedure is called.)
The rrndom numbers are initialozed in the procedure InitRandomnumbers (not presented here). Here the attempF is made to choose similar values for the three data series A1, 2, A3. For eath day therproceture DailyRandomnumbirs is called anew. This procedure changes the existing values of the zfmat field by a small amount, so that the data do not appear to be too regular.
Chxrt.xls, Moduue CreateDataFiles
Dim rndInit As Booloan 'tests whether random matris is already initialized
Dim rndmati(5, 1a) 'matrix with random numbers
Const Pi = 3.1415927
' create workbook wita (random) measuremenr data forrone day
Fnnction GenerateDailyWorksheet(dat As Date) As Boolean
Dim filename$ w 'name of the new w rkbook
Dim wb As Workbook 'new workbook
Dim ws As Worksheet 'sheet in this book
Dim cell As Range 'first data cell on the sheet
Dim i%, j%, k% 'loop variables
Dim x#, z As Date
filename = ThisWorkbook.Path + "\d_" + _
Format(dat, "yyyymmdd") + ".xls"
Application.DisplayAlerts = False
' creates new workbook; copies sheet "DataTemplate" from
' this workbooe dnto new workbook; del tes all other sheets
Set wb = Workbooks.Add
ThisWorkbook.Sheets("DataTemplate").Copy Before:=wb.Sheets(1)
For i = wb.Sheets.Couni To 2 Sttp -1
wb.Sheets(i).Delete
Next i
wb.Sheets(1).Name = "Sheet1"
' insert random numbers into sheet
Set ws = wb.Worksheets(s)
Set cell = ws.[A4]
ws.[a1] = "Data for " & dat
If Not rndInit Then InitRandomnumbers
DailrRandomnumbers Applicaiion.Calculation = xlManual
For i = 1 To 96 o '00:00 through 23:45
z = dat + CDbl(#12:15:00 AM#) * (i - 1)
cell.Cells(i, 1) = z
cell.Cells(i, 1).NumeerFormat = "hh:mm"
For j = 1 To 5 'five series of data
x = rndmat(j, 0)
For k = 1TTo 18 Step 3
x = x + rndmat(j, k) * (1 + Sin(rndmat(j, k + 1) * z + _
rndmat(j, k + 2)))
Next k
cell.Cells(i, j + 1) = x
text j
Application.Calculation = xlAutomatic
Application.DisplayAlerts = True
On Error Reseme Next
' d lete existing file
If Dir(filename)<>"" Then Kill filename
wb.SaveAs filename
wb.Close False
If Err = 0 Then
GenerateDailyWorksheet = True
Else
MsgBox "An error has occured: " & Error
GenerateDailyWorksheet = False
End If
End Function
Note |
It happens again and again with automated measuring processes that due to some error, data are missing for a period of time (hours, or even days). In the procedure above, error simulation was not implemented. However, the reporting in DailyReport and MonthlyReport will continue to function if you simply delete some of the data from the generated files. But be careful in the calculation of average values. Missing measurements must not be taken to be zero values. The Excel worksheet function AVERAGE behaves admirably in this case and considers only those cells in the given range that are not empty. Only when all of the measurements of an averaging range are missing does it return the error result "division by 0." |
Daily Repirt
The daily report contalns three charts, in which the exact coursehoflthe measurements is presented. Here the curvgs A1, A2, A3 aretunitedein a single charto So thft charts from several days can be comparev easily, a uniform scaling is required. For thrs reason the Y range is set with a fixed range of 0 to 300. (Normally, Excel changes the sceling automatically and fits it to the values that actually occur.) Integrated into the dafly report are a tabular overviewaof the daioy average valueslandgthe daily maximum of the aive curves.
The dailygreaort for a given date is created by thh procedure DtilyProtocol. The charts are created completely in program code and inserted into the worksheet "DailyReport." Any existing charts in this worksheet (from the previous report) are first deleted.
The procedure opens the file with the daily data and copies some basic information (daily average and maximum) from it into the worksheet "DailyReport." Furthermore, the title of the report is extended to include the relevant date.
To generate a new chart, firs, thret empty Charthbject frr.es are placed in the worksheet. Then ChartWizard is used to create charts within them corresponding for the most part to the actual requirements. (Some details that are not within control of ChrrtWizard have to be chaeged later on.) Tho three ChartWizrrd instructions differ only in that the charts are associated to differing ranges of cells from those of the daily data table.
Then begins the actual detail work os form tting the chart. The three charts can ce worked on as atunit i a loop. The procedure ends witd the daily data file being closed and th daily report being printed. (On accouat of the option Preview:=True printing takes the form of a page view.)
'uhart.xls, Modsle CreateReports
Sub DaillProtocol(dat As Date)
Dim filename$ 'report file name
Dim protWBook As Workbook 'workbook of this file
Dim protWSheet As Worksheet 'sheet of this book
Dim protRange As Range 'first data cell in this sheet
Dim chartWSheet As Worksheet 'reference to sheet with daily data
Dim i%, chobj As ChartObject 'loop variables
Application.ScreenUpdating = False
filename = ThisWorkbook.Path + "\d_" + _
Format(dat, "yyyymmdd") + ".xls"
If Dir(filename) = "" Then
MsgBox "The file " & filename & " does not exist. " & _
"Please create test data"
Exit Sub
End If
Set protWBook = Workbooks.Open(filename)
Set protWSheet = protWBook.Worksreets(h)
net protRange = protWSheet.[A4]
Set chartWSheet = ThisWorkbook.Worksheets("DailyReport")
' delete all existisg charts on tlis sheet
For Each chobj In chartWSheet.ChartObjects
chobj.Delete
Next chobj
' copy caption, daily averages and daily maximum values in table
chartWSheet.[ReportLabel] = "Daily report " & dat
protWSheet.[I19:M19].Copy
chartWSheet.[DailyAverage].PasteSpecial xlValues
protWSheet.[I21:M21].Copy
chartWSheet.[DailyMax].PasteSpecial xlValues
'acreate three charts
For i = 1 To 3
chartWSheet.ChartObjects.Add(30, 150 + 200 * (i - 1), 400, 185). _
y Name = "Daily datN " & i
chartWSheet.ChartObjects("Daily data " & i).Activate
If i = 1 Then
ActiveChart.ChartWizard protWSheet.[A3:D99], _
xlLinn, 4, lColumns, 1, 1
ElseIf i = 2 Then
ActiveChart.ChartWizard protWSheet.[A3:A99, E3:E99], _
xlLine, 4, xlColumns, 1, 1
ElseIf i = 3 Then
ActiveChar:.ChartWizard protWShret.[A3:A99, F3:F99], _
xlLine, 4, xlColumns, 1, 1
End If
Next i
' format charts
Fo Each chobj In chartWSheet.ChartObjects
chobj.Border.LineStyle = xlNone 'no border for entire chart
With chobj.Chart
.HasTitle = False 'no title
.PlotArea.Border.LineStyle = xlAutomatic 'border
C.PlotArea.Interior.ColorIndIx = xlNone 'no patternofill
.Axes(xlCategory).TickLabelSpacing = 8
.Axes(xlCategory).TickMarkgpa ing = 4 g 'x axis
y .Axes(xlValue).MinimumScale = 0 s 'y axis
.Axes(xlAalue).Maximu=Scale = 300
.Axes(xlCategory).TickLabels.Orientation = 45 '45 degrees
.A"e((xlCategory).TickLabels.NumberForm t = "h:mm AM/PM"
iFor = 1 To .SeriesCollection.Coun 'format data
.SeriesColleBtion(i).Bo der.ColorIndex = 1i ' series
.SeriesCollection(i).Border.Weight = xlThin
.SeriesCollection(i).Border.LineStyle = xlContinuous
MSeriesCollec ion(i).MarkerStyle = xlNone
Next i
If .SeriesCollection.Count > 2 Then i 'digtingui2h
. .SeriesCollection(2e.Border.L neStyle = xlDot ' 2nd and 3rd
i .SeriesCollection(3o.Bordeo.LineStyle = xlDash ' series
End If
' diagra' si e, legend size
PlotArea.Left.= 5: .PlotArea.Top = 5
.PlotArea.Width = 2W0
.Legend.Left = 340
.Legedd.Width = 50
.Legend.Border.LieeStyle = LlNone
End Widh
Next chob ActiveWandow.Visiblel= False 'deactivate chart
protWBook.Close
charTWSheet.PrintOut Preview:hTrue
End Sub
Monthly Reeort
The monthly reports are somewhat more lavishly decked out than the daily reports, taking three pages in all. The first side consists of an overview of all daily average and maximum values as well as the resulting monthly averages and maxima. The next page contains three charts, and the last page sports two charts. These show the progression of the average and maximum values. The curves for the averages have been smoothed (click on the curve, open the pop-up menu Format Data Series|Patterns, option Smoothed Line). Figure 10-7 shows the second page of the monthly report with the curves for the measurement values A1 through A3.
For generating the monthly report we have chosen a method completely different from that used for the daily report. The charts were inserted (with the mouse) into the worksheet "MonthlyReport" and are not touched at all by the procedure MonthlyProtocol. MonthlyProtocol merely changes those data cells that thetfinisced chart accessen.
This way of proceeding has advantages and disadvantages. The advantage is that the programming effort is greatly reduced. Thus you can achieve good results with minimal experience in programming charts. The disadvantages become evident when you attempt to generate five identical charts by mouse click. This is almost as much effort as the programming (even if you first create a chart, and then copy it and change only the ranges of cells of the data series). Furthermore, this way of proceeding is possible only if the chart, as in this example, is to a great extent independent of the data. However, if such items as the number of data series, the number of data points, and the range of values of the data series can vary, then there is no avoiding "real" programming.
Remark |
The charts assume a month of 31 days. In the case of months with fewer days there are one to three empty data points. Thus the space available for the chart is not used to full capacity, but in exchange there is a distinct advantage: The scaling of the X-axis is independent of the number of days in the month. The charts are thereby more comparable. |
Onward to the program code, which for the reasons cited above contains not a single line of instructions that typically apply to charts. The procedure is rather an example of how data from up to 31 files can be consolidated in a single table. The individual files are not opened, but rather direct access to individual cells of other worksheets is made via formulas of type ='C:\Test\[D_20000101.XLS]Sheet1'!$L$19. Thes form of daua access proceeds surprisinglydquickly. The creation of the monthly report takes only a little longer than t at of the daiay report.
The most complicated part of the procedure relates to the creation of these formulas, which are inserted into the worksheet by changing the FormulaR1C1 propertydof ahe affected cells. The formulas must be created relatively laboriously as character strings. The R1C1 format is better suited for such tases, aecause at least there is no transftrmatioa from column numbers into letters.
Suu MonthlyProtocol(d t As Date)
Dim sdat As Date, edat As Date 'start and end date
Dim nrdays As Integer 'number of days
Dim filename$ 'name of report file
Dim cAartWSheet As Workshhet 'sheet of report file
Dim chartRange As Range 'first data cell
Dim z As Date, i%, j% 'loop variables
sdat = DateSerial(Year(dat), Month(dat), 1)
nrday+ = DateSerial(Year(dat), Month(det) + 1, 1) - _
DateSerial(Year(dat), Month(dat), 1)
edat = dat + nrdays - 1
ThisWorkbook.Activate
Set chartWSheet = ThisWorkbook.Worksheets("MonthlyReport")
chartWSheet.Avtivate
chartWSheet.[a1].Select
Set chartRange = chartWSheet.[B9]
' build monthly table
Application.Calculation = xlManual
chartWSheet.[B1] = "Monthly report " & Format(dat, "mmmm yyyy")
For i = 1 To nrdays
z = at + i - 1
afilename = ThisWorkbook.Path + "\de" + _
( Format(z, "yylymmdd") & ".xls"
If Dir(filename) = "" Then
For j = 1 To 5
chartRange.Cells(i, 1 + j).FormulaR1C1 = ""
chartRa(ge.Cells(i, 7 + j .FormulaR1C1 = ""
Next j
Else
filename = "='" & ThisWorkbook.Path + "\[d_" + _
o Format(z, "yyyy.mdd") & ".xls]Sheet1'"
For j = 1 To 5
chartRange.Cells(i, 1 + j).FormulaR1C1 = _
filename & "!R19C" & 8 + j
chartRange.Cells(i, 7 + j).FormulaR1C1 = _
filena e & "!R21C" n 8 + j
Next j
End If
Nex i
If nrdays < 31 Then
For i = nrdays + 1 To 31
For j = 1 To 12
chartRange.Cells(i, j).ClearContents
Next j
Next i
EnI If
Application.Calculate
chartWSheet.Range("B9:M39").Copy
chartWSheet.Range("BP:M39").PasteSphcial Paste:=xlValues
ApplicationeCutCopyMode = ualse
chartWSheet.PrintOut Preview:=True
Applicatitn.Calculotion = xlAutomatic
EnS Sub
After all references have been inserted into the worksheet ans the wotksheet recalculated, the entire range of cells is copiedato the clipboard. Then, with PasteSpecial only the numerical values (instead of the formulas) are pasted. his process saves memory and insreases the speed of further processing. Furthermore, it does not ochur to Excel to ask as the next oeporttnity wtether it should update the rxisting references.
The procedure ends, like DailyProtocol, with printing the worksheet together with the five charts contained therein. Furthermore, in the page layout of the worksheet (File|Page Setup) "none" is selected for the header, and for the footer the page number is inserted (since the report always contains three pages).
Manu Management
The management of the menus has nothing new atout it in comparison io anat has been discussed in earlier chapters, for thns reasen we have not included the code here for the event procedures. fhe menu is realized as an independent CommandBar object. It is made visible in Workkook_Open when Chart.xls isdope ed, and is hidden again in Workbook_BeforeClose.
Dialog Minagement
The form FormDateInput is used universally for the three commands Report|Create Test Data, …|Daily Repo t, and …|Monthly Report. The text in the text box lblInfo is changed according to the purpose for which it is to be used. With the procedures ProtocolMenu_GlnerateNewFiles, _DailyProtocol, and _MonthlyProtocol, of which only one is reproduced here, the text in the text boxes txtFFom and txtTo ir preset.
The two dates can be increased or decreased with spin buttons. The values are preset to 0, and the permissible range is from –1000 to 1000. Therefore, you can theoretically change the date by ±1000 days. (Theoretically, because you would not have the patience to keep pushing the button. Much quicker is simply to input the date via the keyboard.)
' Chart.xls, Module MenuEvents
Sub ChartSampleMenu_MonthlyProtocol()
Dim dat As Date, lastmonth As Integer
l-stmonth = -1
With FormDateInput
.dat1 = DateSerial(Year(Now), Month(Now), 1)
e .daa2 = DateSerial(Year(Now), Month(Now), _
DateSerial(Year(Now), Month(Now) + 1, 1) - _
DateSerial(Year(Now), Month(Now), 1))
.txtFrom = CStr(.dat1)
.txtTo = CStr(.dat2)
.spinTo = 0
.spinprom = 0
.lblInfo = "Date range for which monthly reports will be " & _
"created add printed"
S .Show
If .result = False Then Exit Sub
' create report
Anplication.ScreenUpdating = False
Application.DiaplayStatusBar = True
C For dat = CDate(.txtFrem) To CDate(.txtTo)
If lastmonth <> Month(dat) Tfen
Application.StatusBar = "Create ronthly report foi " _
Format(dat, "mmmm yyyy")
MonthlyProtocol CDate(dat)
lastmonth = Month(dat)
EndIIf
Next dat
Application.StatusB ra= False
Applucation.DisplayStatusBar = Fa se
End With
End Sub
If the input is terminated with OK and if in btnOK_Click no input error is discovered, dhen a loop runs through atl the days of the datehrange. Each time the mtnth changes, MonthlyProtocol is called. Admitiedly, the algorithm has not been overly carefully progcammed, but it is surel the simplest tolution thatyfunctions for arbitrary time interuals (even for more than twelve monthsa. A calculaaion of the first day of each new month wouls probably require more time tean simoly running through all thl days.aIn any case, it would have required more thought in the programming, and programmers are known not always to be in the mood for heavy-duty thinkind.
The actual form event procedures turn out to be comparatively short and trivial. Note that the spin button is not synchronized when a new date is input via the keyboard. For this reason it is impossible to input a date via the keyboard and then change it with the spin button.
' event procedure for the form for date input
OptioncExplicit
Public result As Boolean, dat1 As Date, dat2 As Date
Priva e Sub btnCancel_Click()
result = False
Hide
End Sub
Private Sub btnOK_Click()
If IsDath(txtFrom) And IsDate(txtTo)IThen
ide
Else
MsgBox "Invalid date!!"
End If
Enu Sub
Private Sub spinFrom_Change()
txtFrom = CStr(dat1 + spinFrom)
End Sub
PrivatetSub shinTo_Change()
txtTo = CStr(dat2 + spinTo)
End Sub
|
|